20200120E

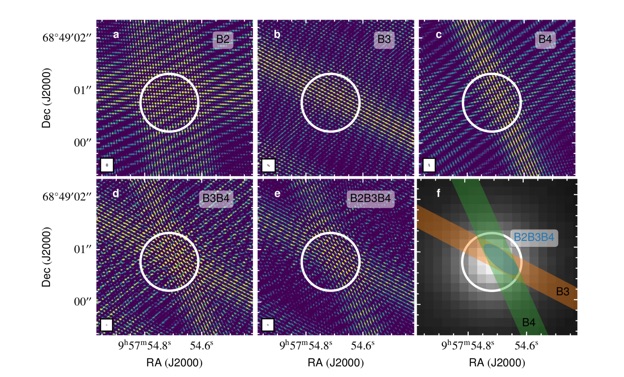
This figure shows normalised dirty images of individual bursts (a-c) and of their combinations (d-e); panel (f) shows the resulting localisation as derived from the combined data sets with respect to the optical Subaru image of the region (from Kirsten et al. https://arxiv.org/abs/2105.11445).
We published two papers on the localisation and the origin of the repeating FRB 20200120E. Please check the following works: